
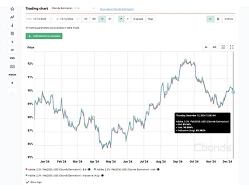
Hong Kong Yield Curve 20Y
Encontrar, guardar y rastrear instrumentos de inversión con Cbonds WATCHLIST
Con Cbonds Watchlist siempre puede estar al tanto de sus inversiones y tomar decisiones consciente!
Encuentra bonos por rentabilidad, rating y otros criterios con más de 50 filtros.
Prueba gratuita: 7 días para empresas · 3 días para particulares
Con Cbonds Watchlist siempre puede estar al tanto de sus inversiones y tomar decisiones consciente!
Hong Kong yield curve for 20 years maturity, characterizing the long-term structure of government bond yields.
Se puede recibir los datos de este índice via complemento Cbonds para Excel usando la fórmula CbondsIndexValue(91533, date)
complemento Cbonds| Índice | Último valor | Fecha |
|---|---|---|
| Hong Kong Yield Curve 1W | 2,54 % | 28/10/2026 |
| Hong Kong Yield Curve 1M | 2,51 % | 28/10/2026 |
| Hong Kong Yield Curve 3M | 2,79 % | 28/10/2026 |
| Hong Kong Yield Curve 6M | 3,02 % | 28/10/2026 |
| Hong Kong Yield Curve 9M | 3,15 % | 28/10/2026 |
| Hong Kong Yield Curve 12M | 3,28 % | 28/10/2026 |
| Hong Kong Yield Curve 2Y | 3,505 % | 28/10/2026 |
| Hong Kong Yield Curve 3Y | 3,66 % | 28/10/2026 |
| Hong Kong Yield Curve 5Y | 3,727 % | 28/10/2026 |
| Hong Kong Yield Curve 10Y | 3,941 % | 28/10/2026 |
| Hong Kong Yield Curve 15Y | 4,17 % | 28/10/2026 |
| Hong Kong Yield Curve 20Y | 4,574 % | 28/10/2026 |