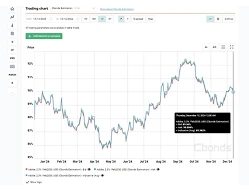


Russia Capacity Utilization
Encontrar, guardar y rastrear instrumentos de inversión con Cbonds WATCHLIST
Con Cbonds Watchlist siempre puede estar al tanto de sus inversiones y tomar decisiones consciente!
Explore bonos aplicando más de 50 filtros avanzados (calificación, rentabilidad, precio y más)
Solicite su accesoCon Cbonds Watchlist siempre puede estar al tanto de sus inversiones y tomar decisiones consciente!
Todo lo que necesita para el análisis y el seguimiento de renta fija.
This reflects the average utilization of manufacturing facilities. It is calculated as the ratio of the actual production of products to production capacity, which operated in the reporting period for the production of these products. Without exceptions for seasonality Production capacity loading data is published in conjunction with entrepreneurial confidence data. Usually published up to 18 working day after the end of the month.
Se puede recibir los datos de este índice via complemento Cbonds para Excel usando la fórmula CbondsIndexValue(51259, date)
complemento Cbonds| Índice | Último valor | Fecha |
|---|---|---|
| Argentina Capacity Utilization | 58,4 % | 31/05/2026 |
| Australia Capacity Utilization | 74 % | 31/07/2026 |
| Brazil Capacity Utilization | 77,3 % | 31/05/2026 |
| Colombia Capacity Utilization | 79,5 % | 30/04/2026 |
| Japan Capacity Utilization | 103 Points | 31/05/2026 |
| Maldives Occupancy Rate | 40,4 % | 30/06/2026 |
| Mexico Capacity Utilization | 80,4 % | 31/05/2026 |
| Philippines Capacity Utilization | 78,9 % | 30/06/2026 |
| Russia Capacity Utilization | 62 % | 31/07/2026 |
| South Korea Capacity Utilization | 105,3 Points | 30/06/2026 |
| France Capacity Utilization | 76,8 % | 30/06/2026 |
| Thailand Capacity Utilization | 57,61 Points | 30/06/2026 |
| Turkey Capacity Utilization | 73,9 % | 31/07/2026 |
| United States Capacity Utilization | 76,1 % | 30/06/2026 |