


PFTS Index
Encontrar, guardar y rastrear instrumentos de inversión con Cbonds WATCHLIST
Con Cbonds Watchlist siempre puede estar al tanto de sus inversiones y tomar decisiones consciente!
Explore bonos aplicando más de 50 filtros avanzados (calificación, rentabilidad, precio y más)
Solicite su accesoCon Cbonds Watchlist siempre puede estar al tanto de sus inversiones y tomar decisiones consciente!
Todo lo que necesita para el análisis y el seguimiento de renta fija.
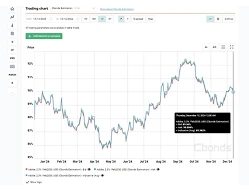
The PFTS index has been calculated since October 1, 1997, based on the prices of the most actively traded shares on the stock exchange. The index basket consists of 20 issuers representing different sectors of the economy. The index serves as an indicator of market movement. The list of shares for calculating the PFTS index is formed by the PFTS index committee on securities, which are included in the PFTS list, based on data on market capitalization, trading volume, number of agreements and other factors that affect the liquidity of shares.
Se puede recibir los datos de este índice via complemento Cbonds para Excel usando la fórmula CbondsIndexValue(247, date)
complemento Cbonds| Índice | Último valor | Fecha |
|---|---|---|
| KASE Index | 8.039,86 | 14/08/2026 |
| PFTS Index | 428,88 | 13/08/2026 |
| Ukrainian exchange | 1.194,15 | 05/07/2024 |
| GSX (Georgia) | 292,92 | 23/07/2026 |
| KSE (Kyrgyzstan) | 8.314,86 | 27/07/2026 |
| UCI Index | 1.228,99 | 14/08/2026 |
| AIX Qazaq Index | 2.402,59 | 14/08/2026 |