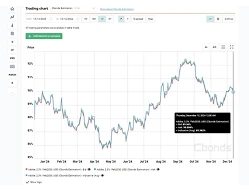



SGS Yield Curve 5Y
Encontrar, guardar y rastrear instrumentos de inversión con Cbonds WATCHLIST
Con Cbonds Watchlist siempre puede estar al tanto de sus inversiones y tomar decisiones consciente!
Explore bonos aplicando más de 50 filtros avanzados (calificación, rentabilidad, precio y más)
Solicite su accesoCon Cbonds Watchlist siempre puede estar al tanto de sus inversiones y tomar decisiones consciente!
Todo lo que necesita para el análisis y el seguimiento de renta fija.
Singapore 5-Year government bonds yield in local currency (SGD). Updated with daily frequency on business days.
Se puede recibir los datos de este índice via complemento Cbonds para Excel usando la fórmula CbondsIndexValue(180643, date)
complemento Cbonds| Índice | Último valor | Fecha |
|---|---|---|
| SGS Yield Curve 6M | 1,55 % | 12/08/2026 |
| SGS Yield Curve 1Y | 1,66 % | 12/08/2026 |
| SGS Yield Curve 2Y | 1,68 % | 12/08/2026 |
| SGS Yield Curve 5Y | 1,98 % | 12/08/2026 |
| SGS Yield Curve 10Y | 2,28 % | 12/08/2026 |
| SGS Yield Curve 15Y | 2,34 % | 12/08/2026 |
| SGS Yield Curve 20Y | 2,35 % | 12/08/2026 |
| SGS Yield Curve 30Y | 2,43 % | 12/08/2026 |
| SGS Yield Curve 50Y | 2,56 % | 12/08/2026 |