- Herramientas
- Búsqueda de bonos
- Watchlist
- Bonos
- Acciones
- ETF & Funds
- Índices
- Noticias y Estudios analíticos
- Calendario
- Excel Add-In
- API
- Obtenga una suscripción
bonos globalmente
fuentes de precios
acciones
ETF
The CAPE ratio is a valuation measure that uses real earnings per share (EPS) over a 10-year period to smooth out fluctuations in corporate profits that occur over different periods of a business cycle. The CAPE ratio, using the acronym for cyclically adjusted price-to-earnings ratio, was popularized by Yale University professor Robert Shiller. It is also known as the Shiller P/E ratio. The P/E ratio is a valuation metric that measures a stock’s price relative to the company’s earnings per share. EPS is a company’s profit divided by the outstanding equity shares. The ratio is generally applied to broad equity indices to assess whether the market is undervalued or overvalued. While the CAPE ratio is a popular and widely-followed measure, several leading industry practitioners have called into question its utility as a predictor of future stock market returns.
Índice | Último valor | Fecha |
---|---|---|
ASX 200 | 7.642,1 | 18/04/2024 |
ASX 50 | 7.485,8 | 18/04/2024 |
Australian All | 7.898,9 | 18/04/2024 |
Dow Jones | 37.775,38 | 18/04/2024 |
KOSPI | 2.634,7 | 18/04/2024 |
MSCI ACWI | 749,39 | 18/04/2024 |
MSCI EM Materials | 357,14 | 18/04/2024 |
MSCI Emerging Market | 1.018,59 | 18/04/2024 |
MSCI Emerging Markets Utilities | 220,78 | 18/04/2024 |
MSCI Turkey | 320,98 | 18/04/2024 |
MSCI USA | 4.771,97 | 18/04/2024 |
MSCI World IT | 633,54 | 18/04/2024 |
MSCI World Index | 3.280,1 | 18/04/2024 |
MSCI World Info Tech Net | 766 | 18/04/2024 |
NASDAQ 100 | 17.394,31 | 18/04/2024 |
NASDAQ Biotechnology NTR | 1.263,29 | 18/04/2024 |
NASDAQ Composite | 15.601,5 | 18/04/2024 |
NASDAQ-100 Notional NTR | 20.031,96 | 18/04/2024 |
NYSE Composite | 17.388,09 | 18/04/2024 |
NZX 50 | 11.836,04 | 18/04/2024 |
Nikkei 225 | 38.079,7 | 18/04/2024 |
Nikkei Volatility Index | 21,49 | 18/04/2024 |
Russell 2000 | 1.941,85 | 18/04/2024 |
S&P 500 | 5.011,12 | 18/04/2024 |
S&P MidCap 400 | 2.825,94 | 18/04/2024 |
S&P/TSX 60 | 1.300,29 | 18/04/2024 |
S&P/TSX Composite | 21.708,44 | 18/04/2024 |
S&P/TSX Venture Composite | 570,89 | 18/04/2024 |
STI | 3.187,66 | 18/04/2024 |
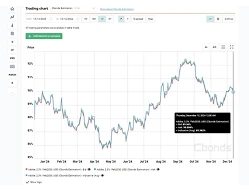
Shiller PE Ratio (CAPE ratio) | 33,23 | 29/02/2024 |
TA-125 | 1.933,98 | 18/04/2024 |
TA-35 | 1.912,45 | 18/04/2024 |
VIX Index | 18 | 18/04/2024 |
Wilshire 5000 | 49.238,9 | 18/04/2024 |