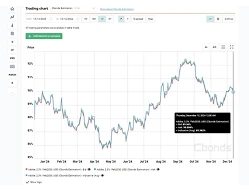



DCE Agricultural Futures Price Index
Encontrar, guardar y rastrear instrumentos de inversión con Cbonds WATCHLIST
Con Cbonds Watchlist siempre puede estar al tanto de sus inversiones y tomar decisiones consciente!
Explore bonos aplicando más de 50 filtros avanzados (calificación, rentabilidad, precio y más)
Solicite su accesoCon Cbonds Watchlist siempre puede estar al tanto de sus inversiones y tomar decisiones consciente!
DCE Agricultural Futures Price Index is a simple price index of agricultural futures listed on the Dalian Commodity Exchange and serves as a key benchmark for China’s agricultural sector. In August 2026 the index reached a high of 2318.10 points and a low of 2165.92 points, averaging 2233.07 points. The index comprises palm oil (31.19 %), soybean meal (29.26 %), soybean oil (28.45 %), corn (7.72 %) and category-1 soybeans (3.38 %).
Se puede recibir los datos de este índice via complemento Cbonds para Excel usando la fórmula CbondsIndexValue(180333, date)
complemento Cbonds| Índice | Último valor | Fecha |
|---|---|---|
| DCE Agricultural Futures Price Composite Index | 2.026,76 Points | 15/09/2026 |
| DCE Agricultural Futures Price Index | 2.286,73 Points | 15/09/2026 |
| DCE Ferrous Futures Price Index | 4.127,95 Points | 15/09/2026 |
| DCE Industrial Futures Price Composite Index | 3.948,42 Points | 15/09/2026 |
| DCE Oils and Oilseeds Futures Price Index | 2.432,21 Points | 15/09/2026 |
| DCE Petrochemical Futures Price Index | 1.779,05 Points | 15/09/2026 |