


Está en modo consejo Apagar

Pruebe 7 díasgratis con acceso demo

  • Acceda en línea a toda nuestra base de datos
  • Filtre como un profesional con más de 50 criterios
  • Haga un seguimiento inteligente de su cartera
  • Consulte precios de bonos de más de 400 fuentes confiables
  • Tome decisiones informadas con datos completos y precisos

Explore bonos aplicando más de 50 filtros avanzados (calificación, rentabilidad, precio y más)

Solicite su acceso

Philippines Government Bond Yield Curve

El número máximo de líneas de curvas que se pueden añadir al gráfico -
No data to create a table

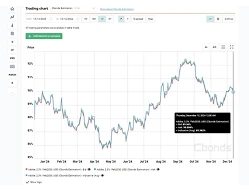
Philippines yield curve is a graphical representation of interest rates on Philippine government bonds across different maturities. The term structure of yields represented by this benchmark serves as a reference point for analyzing interest rates and fixed-income market expectations. The curve includes 11 tenors ranging from 1 month to 20 years. Values are published on each business day for the previous trading day.

FAQ

  • What factors drive changes in the Philippines yield curve?

    Domestic factors include decisions by the central bank of the Philippines (Bangko Sentral ng Pilipinas, BSP), inflation, movements in PHP, the economic growth outlook, fiscal indicators, and changes in public debt. Among the external factors, global financial conditions, external financing costs, and investor demand for Philippine government bonds play an important role. Developments in Asian financial markets also have an additional influence.
  • What can the shape of the yield curve reveal about the likely future path of interest rates?

    The market interprets the likely path of interest rates and borrowing costs through four principal yield curve configurations:
    • A normal slope indicates expectations of gradually rising or stable rates, as the current monetary-policy stance is viewed as appropriate and long-term rates naturally exceed short-term rates. Further increases would be expected only if economic growth accelerated above its potential rate.
    • An inversion points to an expected rate-cutting cycle: market participants assume that currently elevated rates are restrictive, will cool the economy, and will ultimately force the central bank to ease policy in the near term.
    • A flat slope reflects either expectations that rates will remain high for an extended period or uncertainty about the central bank’s next move. As the market sees no compelling case for either a sharp rise or a rapid decline in rates, the gap between short- and long-term expectations becomes minimal.
    • A humped curve implies a volatile path: rates are first expected to rise or remain near peak levels over the medium term, followed by a material decline at the long end as economic conditions normalise.
  • Which tenor combinations on the curve are most informative for analysing macroeconomic expectations?

    Macroeconomic analysis should distinguish between forecasting objectives. For inflation forecasting, maturities should closely match the relevant forecast horizons; for example, the 5Y–1Y spread can be used to assess the difference between inflation expected over the next five years and inflation expected over the next year. For forecasting real economic activity, empirical evidence generally favours the spread between the longest and shortest available tenors on the yield curve; in practice, the difference between 10-year and 2-year yields is often used.
  • What are the specific considerations when analysing the short and long ends of the yield curve?

    The curve spans 1 month to 20 years and includes 11 points in total.
    • The short-end segment (1 month–1 year) serves as an indicator of current monetary conditions; its tenor density enables track the market’s reaction to central-bank actions and current liquidity conditions.
    • The mid-curve segment (2–7 years) reflects expectations for the economic cycle and inflation over the medium term.
    • The long-end segment (7–20 years) is shaped by fundamental factors such as long-term inflation expectations and the risk premium. Yields beyond 10 years reflect investors’ expectations regarding the macroeconomic stability of the country.
  • When are the new the Philippines yield curve values published?

    The curve values are published on each business day for the previous trading day. For example, data for 6 May 2026 are published on 7 May 2026.

Los datos de las curvas en la página están disponibles por los últimos 3 años - el acceso a datos adicionales está disponible a través de the Cbn-data API


Contacts

Acceso a datos
Hay que registrarse para recibir el acceso.